Tooling for machine learning: f-ANOVA
Last time I read Hutter’s article on assessing parameter importance: it is interesting, but how to apply it without some tooling? Well, at the article’s bottom there was a link to a tool, but the article was dated 2014 so it could have been abandoned. I am lucky, after searching a bit I have found the new location:
So the tool is now part of a bigger initiative https://www.automl.org/ whose goals are:
- making machine learning more accessible
- improving efficiency of machine learning systems
- accelerating research and AI application development
This initiative is led by Prof. Frank Hutter (University of Freiburg), and Prof. Marius Lindauer (the Leibniz University of Hannover).
The last git commit dates 2020, but the documentation seems good and the tool easy to use. This is the f-ANOVA quick start guide.
To analyze hyper-parameters importance you need to prepare a couple of files, one containing the parameter values, and one containing the loss-function result after the testing.
>>> from fanova import fANOVA
>>> import csv
>>> X = np.loadtxt('./online_lda_features.csv', delimiter=",")
>>> Y = np.loadtxt('./online_lda_responses.csv', delimiter=",")
>>> f = fANOVA(X,Y)
>>> f.quantify_importance((0, ))
 0.075414122571199116
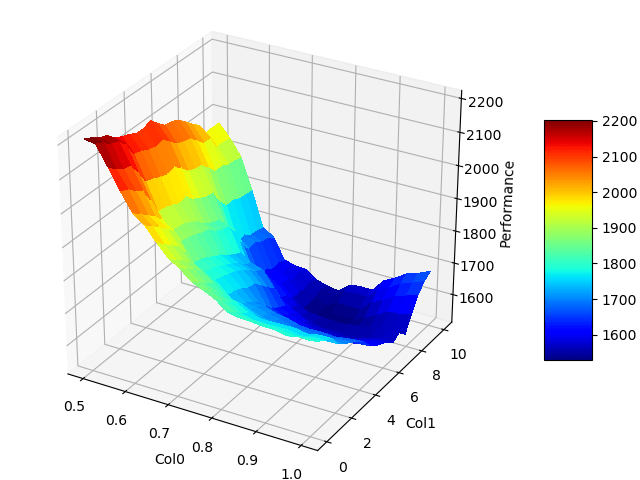
You provide the inputs and with the last method you get the importance of the 1st parameter: it is a little value other parameters must be more important for this model. You simply do the same with the other parameters and decide which parameter should be investigated the most. You can also use the get_most_important_pairwise_marginals method to understand which parameters interact the most. The package provides also some visualization function that allows showing beautiful graphs like this one:
The f-ANOVA starter page explains briefly how to proceed and interpret the results.
The code is available on GitHub: https://github.com/automl/fanova/tree/master/examples/example_data/online_lda

Leave a comment