Archive for October 2022
Tooling for machine learning: f-ANOVA
Last time I read Hutter’s article on assessing parameter importance: it is interesting, but how to apply it without some tooling? Well, at the article’s bottom there was a link to a tool, but the article was dated 2014 so it could have been abandoned. I am lucky, after searching a bit I have found the new location:
So the tool is now part of a bigger initiative https://www.automl.org/ whose goals are:
- making machine learning more accessible
- improving efficiency of machine learning systems
- accelerating research and AI application development
This initiative is led by Prof. Frank Hutter (University of Freiburg), and Prof. Marius Lindauer (the Leibniz University of Hannover).
The last git commit dates 2020, but the documentation seems good and the tool easy to use. This is the f-ANOVA quick start guide.
To analyze hyper-parameters importance you need to prepare a couple of files, one containing the parameter values, and one containing the loss-function result after the testing.
>>> from fanova import fANOVA
>>> import csv
>>> X = np.loadtxt('./online_lda_features.csv', delimiter=",")
>>> Y = np.loadtxt('./online_lda_responses.csv', delimiter=",")
>>> f = fANOVA(X,Y)
>>> f.quantify_importance((0, ))
 0.075414122571199116
You provide the inputs and with the last method you get the importance of the 1st parameter: it is a little value other parameters must be more important for this model. You simply do the same with the other parameters and decide which parameter should be investigated the most. You can also use the get_most_important_pairwise_marginals method to understand which parameters interact the most. The package provides also some visualization function that allows showing beautiful graphs like this one:
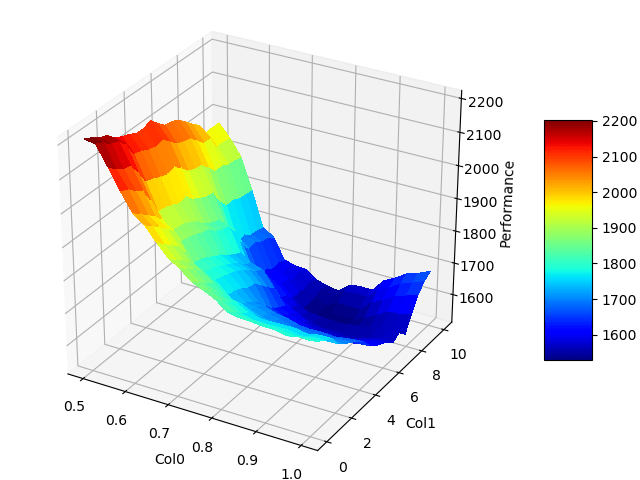
The f-ANOVA starter page explains briefly how to proceed and interpret the results.
The code is available on GitHub: https://github.com/automl/fanova/tree/master/examples/example_data/online_lda
Back on Hyper-parameter importance
Reading the LSTM article on comparing different architectures (“LSTM a search space odissey”) I was curious to understand better theirs approach on identifying important parameters. They referenced this article:
An Efficient Approach for Assessing Hyperparameter Importance. Frank Hutter, Holger Hoos, Kevin Leyton-Brown. Proceedings of the 31 st International Conference on Machine Learning, Beijing, China, 2014. JMLR: W&CP volume 32.
The technique used is called f-ANOVA, which stands for functional analisys of variance. Before looking at I wanted to read a bit on simple ANOVA, just to understand a bit more: as the reading is about statistics, it was really scaring to me – really not my favourite subject.
Luckily the web is full of introductive pages; I read this one “A Simple Introduction to ANOVA (with applications in Excel)“. In a nutshell an anova example is:
A recent study claims that using music in a class enhances the concentration and consequently helps students absorb more information. We take three different groups of ten randomly selected students (all of the same age) from three different classrooms. Each classroom was provided with a different environment for students to study. Classroom A had constant music being played in the background, classroom B had variable music being played and classroom C was a regular class with no music playing. After one month, we conducted a test for all the three groups and collected their test scores.
See “A simple introduction to anova” to know how it can be done
Here the ANOVA test compare more than 2 categories (we have A,B and C groups) and checks if the average is the same or if there is a significative difference between the groups averages. If you have just 2 categories you can use a different test, and also the test itself just answers if the difference is significative, you need to dig more if this is true.
Trying to dig more, I have quickly found many references to complex statistic subjects, so I retained that it is mandatory to find a tool that does the analysis for you, otherwise the risk of making mistakes is too high and already interpreting the results it is not easy.
After that I have come back to the article on f-ANOVA, and luckily for me it was easier to understand that those on statistics.
The idea is more or less this one: we have one loss function that depends on many hyper-parameters, we would like to understand how much each parameter influences this loss function. In this way we spend more time on the important ones.
As in the previous post on searching good hyperparameters values, it is needed to approximate the real loss function f with another one f’ that can be quickly evaluated. As hyper-parameters can be continous (ex. drop rate), ordinal (number of layers), or discrete (training algorithm) they propose to use random forest models to build f’.
To understand quicky what a random forest tree is, you can read https://www.javatpoint.com/machine-learning-random-forest-algorithm . Many decision trees will be built, on each node there will be a test on an hyperparameter value, attached to each leaf there will be a prediction on f’ value c_i. The final predicted f’ is calculated averaging the c_i.
Usually what we do to tune a parameter is just explore the f values we can achieve keeping all the other hyper-parameters fixed: this is bad as we explore the response of f just locally to the fixed hyper-parameters. We do not know if with other fixed values it will be much different. Now that we have an estimated f’ we can do much better.
For instance we can chose one single hyper parameter i, and evaluate the variance of f’ on all the possible values of the other parameters. This is feasible as f’ can be computed quickly, and it turns out the result is linked to the size of the configuration space possible for the i values compared to the all possible parameter configurations. In the end you can decompose the variance V of f’ on the search space into the sum of contributions V_i of each parameter.
Once selected the most important parameter, you can even take 2 of them and plot in 3D how the variance changes, to understand how they are correlated.
This is way too hard to do without a tool. Next week I will look for existing tools for this and the hyper-parameter search, to understand if it is really feasible to do these analysis.
Better than grid or random search
I continued reading the links on hyper-parameters optimization and I have found another interesting article:
Algorithms for Hyper-Parameter Optimization, James Bergstra, Rémi Bardene, Yoshua Bengio, Balàzs Ké́gl, https://proceedings.neurips.cc/paper/2011/file/86e8f7ab32cfd12577bc2619bc635690-Paper.pdf
As I saw with Ray, there are many algorithms that can be exploited, and I wanted to learn more. Is there a better way than just extracting parameters values and trying them to tune a model? The article begins with this phrase:
Several recent advances to the state of the art in image classification benchmarks
have come from better configurations of existing techniques rather than novel ap-
proaches to feature learning. Traditionally, hyper-parameter optimization has been
the job of humans because they can be very efficient in regimes where only a few
trials are possible. Presently, computer clusters and GPU processors make it pos-
sible to run more trials and we show that algorithmic approaches can find better
results
The authors suggests that choosing the hyper-parameters should be regarded as an outer loop in the learning process: in the outer loop you select the hyper parameters, in the inner you train the model, and you keep the model that provides the best results. Once selected the best hyper-parameter you can do a better training with more examples, and finally you have a model that can be exploited. It is therefore important to allocate enough resources and cpu time to the hyper-parameter selection, otherwise you will train a sub-optimal model.
But how can we do better than random or grid search? In my understanding grid and random search work in this way: you select some parameters, you train the model on some sample data (not all because it takes too much time), and you continue until your results (loss function value) do not improve much. Training the model is a very expensive step.
The “trick” is that, after some random/grid iteration, you could start building a model of the loss functions based on the prameters used and the results achieved (they do so after 30 random experiments). If this model is much less expensive than the training, you can then use some other algorithm to guess interesting parameter combinations to test, for instance using some gradient driven method. You choose the next candidate parameter combination in a better way than just extrancting a random combination.
Reality is more complicated than this, and an algorithm that wants to do so needs to take into account that there are relations between the parameters to explore. For instance the number or neurons in layer 2 makes sense only if you decide that your model will have 2 layers. Parameters can be continous (ex. drop rate), ordinal (number of layers), or discrete (training algorithm). The Authors say that the hyper-parameter configuration space is graph-structured.
The paper continues describing two approaches, one based on Gaussian Processes and antother on Parzen-estimators. With gaussian processes the loss function is modeled with gaussian variables; once the model is created, a new candidate point can be searched using exhaustive grid search, or some more complex algorithms, they refers to EDA and CMA-ES. With the Parzen Estimator approach, a reference y* loss function value is taken into account, this is not the best value obtained so far, but some quantiles away from that. The model created predict which parameter combinations will have a certain loss value, that is quite the reverse of the gaussian process where you predict the loss function that will have a parameter combination. From the experiments reported, the second approach is the one that gives bettere results (they experimented selecting 32 hyper-parameters).
The software they developed is called “Hyperopt”: https://github.com/jaberg/hyperopt
Ray Tune
The hyperparameter optimization page on Wikipedia is full of interesting links. It will take me some time to explore them, as I am not satisfied of just having a basic knowledge on grid and random search.
I have followed randomly one of the links in open source softwares for hyperparameters optimization and I have reached Ray Tune. I was expecting some obscure tool but instead I have discovered a superb site full of documentation and examples.
Quoting them, Ray is defined as
Ray is a unified framework for scaling AI and Python applications. Ray consists of a core distributed runtime and a toolkit of libraries (Ray AIR) for simplifying ML compute
Today’s ML workloads are increasingly compute-intensive. As convenient as they are, single-node development environments such as your laptop cannot scale to meet these demands.
Ray is a unified way to scale Python and AI applications from a laptop to a cluster.
With Ray, you can seamlessly scale the same code from a laptop to a cluster. Ray is designed to be general-purpose, meaning that it can performantly run any kind of workload. If your application is written in Python, you can scale it with Ray, no other infrastructure required.
https://docs.ray.io/en/latest/index.html
I have just looked a bit into the Tune module:
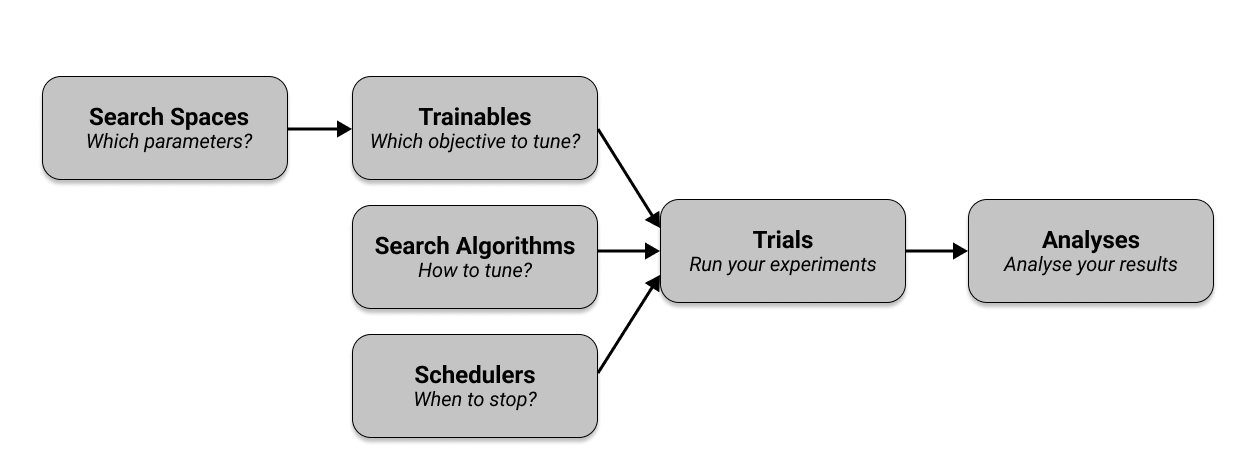
With few python lines you can define, for each of your hyperparameters, the acceptable range. You can then configure a search algorithm to explore the combinations (not just random and grid) and also schedulers to say when it is ok to stop. You pass to the framework the function you want to optimize, and it will do many tests searching for the best parameter combination. Looking at the quickstart example, I imagine you can define a set of experiments like this:
# Define a search space.
search_space = {
    "dropout": tune.grid_search([0.001, 0.01, 0.1]),
    "optimizer": tune.choice([ 'adagrad', 'adadelta', 'sgd']),
}
The quickstart is available on this page https://docs.ray.io/en/latest/tune/index.html , and you can see examples for Keras and PyTorch.
Already this sounds good, but looking a bit around I have found this page: Tune distributed experiments. Ray provides commands to deploy a cluster where you run in parralel your experiments, collect the results, and handles also failures. There are examples for AWS.
Seems really awsome.
Mhhh choosing hyperparameters, this week I am disappointed
Last week I tried to learn more about LSTM, and I was asking myself if there are some rules to choose the hyperparameters. Well, not really rules but al teast some hints: I tried searching for “tuning lstm”, “lstm sizing”, etc and I did not find anything promising. Finally I have found this article:
R.R. Rajalaxmi, L.V. Narasimha Prasad, B. Janakiramaiah, C.S. Pavankumar, N. Neelima, and V.E. Sathishkumar. 2022. Optimizing Hyperparameters and Performance Analysis of LSTM Model in Detecting Fake News on Social media. ACM Trans. Asian Low-Resour. Lang. Inf. Process. Just Accepted (January 2022). https://doi.org/10.1145/3511897
I discovered that some fake news dataset exists, and some researcher are trying to distinguish fake news from true ones, using many different models, not just neural networks.
The ISOT dataset is composed of 21’417 true news and 23’481 fake news. The LIAR dataset instead classifies news in more categories: true, false, mostly true, half true, barely true and pants fire. LIAR is just 6’058 news in total; actually this is the size reported on the paper, on LIAR site the size seems the double – maybe because the dataset comes already divided into train test and validation items.
I was curious to know what a “pants on fire” fake news looks like, here is one:
Wisconsin sold fresh water to California, helping that states dairy industry, and lost a bunch of jobs (and) a bunch of farmland.
LIAR dataset
Ok now I have an idea 🙂
The paper’s authors have built an LSTM model to predict if a news is fake or real; there are no details, I suppose the time factor here is the word position in the phrase, but it is just my guess. Their problem was to pick the right combination of hyperparameters to use, in order to obtain the most accurate model.
To clarify here are some examples
Number of neurons: from 64 to 512
Drop-out rate: from 0.1 to 0.9
Which optimizer to use: adagrad, adadelta, sgd…
I have already found the drop-out rate in other papers: it selects a percentage of neurons to ignore during the training. You may want to do this to prevent the model to overfit the training data: turning randomly off some of your network in the end allows building a less fragile model.
Finally selecting the good hyperparameters combination was just done with grid search and random search. With grid search you just tabulate a long list of possible combination, you take your time to train a model in that case and then compare the results choosing the best one. I did this already many times in a naive way.
With random search insteand, you randomly generate the combinations to be tested. Accoridng to the authors this aproach works in general better.
So in the end I did not find the hints I was looking for, I just come to a new wikipedia page where some more smart methods are also listed: https://en.wikipedia.org/wiki/Hyperparameter_optimization. Maybe the next time I will explore some of them, or I will have a look at the anova method used in the big paper on selecting LSTM architecture: but this one seems requesting a lot of statistics knowledge I don’t have.
Long short term memory (LSTM) – understanding more
Reading just one article on this subject was really not enough for me to undersand. There are still many points not clear and I decided to spend more time on LSTM: read another article, and also search on internet more high level explanations.
I have read the other article proposed by wikipedia on the subject:
Learning to Forget: Continual Prediction with LSTM. Techinical report IDSIA-01-99, January 1999. Felix A. Gers, Jurgen Schmidhuber, Fred Cummins.
The article is from 1999, and it describes why they introduced in the LSTM model the Forget Gate, and explain how this change made the model much more powerful. The reasoning is that, in a recurrent neural network, the output error has to be back-propageted to tune the weights: this becomes a problem considering how the state is memorized.

The cell state in the picture is just a delay, the value at time t will be used at time t+1: if it is updated at each step if will eventually see its value explode due to the sum of errors to track from the beginning of the time. Also the task you have to solve may not require to remember everithing, ad it is legitimate at some point to forget what has happened before. When I have to decide to turn left or right, it has no importance to remember if yesterday a the same time I was turning left, it only matters what I am doing on the current trip, not yesteday’s trip.
This is much more clear considering the benchmark they have chosen, the Embedded Reber Grammar (see this explanation https://cnl.salk.edu/~schraudo/teach/NNcourse/reber.html)

So each message in this grammar can start with BT or BP. If it starts with BT it has to finish with TE, if it starts with BP it has to end with PE. The machine learning model has then to be able to remember this information until the end of the string, which has a variable length, because as you can see in the other blocks of the grammar there are loops. Then as you can see the same grammar block is repeated in the top and bottom branch, but still contains loops, so it is needed to remember what happened in the previous inputs. In the paper they explain that, if you generate 8000 strings, there is a big change you will get one string of at least 50 symbols, so the LSTM will need to remember the BP or BT sequence for a lot of time!
The LSTM model with forget gate is not only able to predict the next symbol of the input stream for the embedded reber grammar, but also the even more complex problem of recognizing sequences of ERG messages. They call this problem the Continuous Embedder Reber Grammar CERG, where one ERG strings follows the other without interruptions. The forget gate will learn whent an EGR sequence is complete and a new one has to start, and will reset the memory cell state, in this way the previous message will not have effect on the current phrase.
So at the beginning of the training the forget gate will be in a state that is near to 1, which means keep the memory untouched, and the memory c will be inizialized with 0. At some point during the training, the forget gate will learn the correct combination of input and previous state that must trigger a reset, and in this case the forget gate will give 0, and make the memory start from scratch. The memory has a formula like c_t+1 = … + forget_gate * c_t, so when the forget gate is 0 it clears the memory.
The role of the other gates in the schema, the input and the output gates, is similar. Theirs value goes from 0 to 1 so that, when the value is close to zero, irrelevant noise and input will not reach the cell changing the state.
To make things simple, I have spoken of c_t but actually nothing prevent introducing many c_1t c_2t etc and have many memory cells. This is actually what is done in the paper, where the model to recognize sequences of ERB strings is composed of 4 LSTM each of them having 2 cells c1 and c2.
If you want a more clear an long explanation I sugget to read https://medium.com/analytics-vidhya/lstms-explained-a-complete-technically-accurate-conceptual-guide-with-keras-2a650327e8f2 where all the pieces are introduced step by step, and the usual picture of LSTM element is decomposed and explained.

Another nice article to read is this one http://colah.github.io/posts/2015-08-Understanding-LSTMs/,
Still after all of this I ask myself how this kind of models have to be sized, if there are some hints on how many c cells to use or h elements to consider. I will continue reading to see if I find something interesting.
